Visual Analyzer


Unleashing Insights with Advanced Analytics
The Visual Analyzer allows users to perform statistical analyses and extract valuable insights through advanced visualization tools, all at the click of a button. Without the need for coding or familiarity with advanced tools like JMP, Origin, Matlab, or complex Excel functions, users can generate and share insights easily.

Informed Data-Driven Decisions
By uncovering correlations, trends, and patterns within the R&D process, our Visual Analyzer enhances the organization's ability to make informed, data-driven decisions. This tool enables teams to quickly identify key insights and apply them to improve processes and outcomes. With clear visualizations and accessible data, your organization can drive efficiency and innovation, ensuring that every decision is backed by solid data analysis.

Analysis and Visualization Tools
The platform enhances material research with tools that allow you to quickly slice and dice your data, identifying the most promising materials, formulations, or experiments. It includes interactive visual tools for examining distributions, correlations, and statistical variations. Additionally, you can overlay measurement curves such as spectra, X-ray diffraction, and IV curves, to conduct comprehensive studies more efficiently.

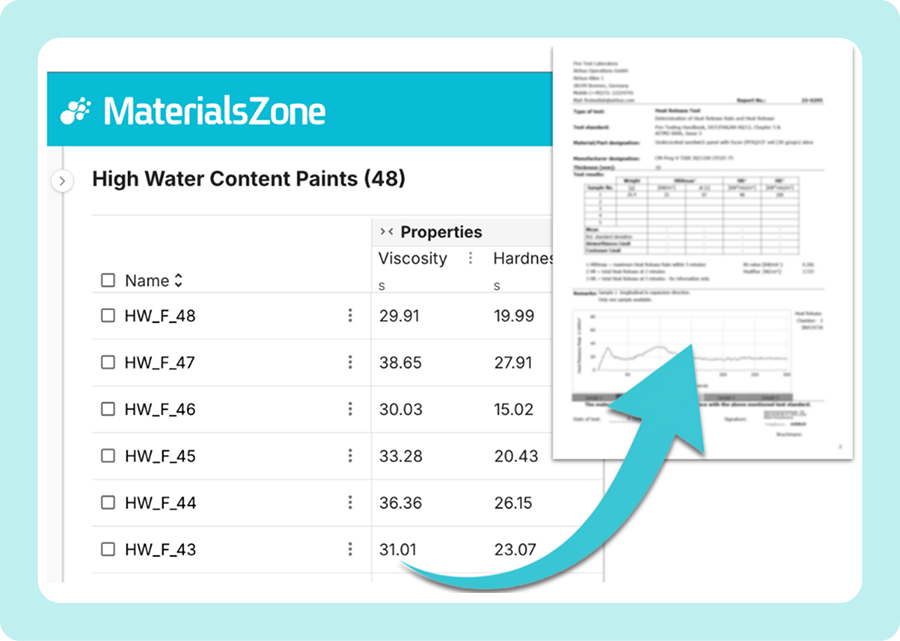
Automated Report Generation
Generate any report, from Product Carbon Footprint reports to Certificates of Analysis (COA) and Technical Data Sheets (TDS), using the data collected and unified in MaterialsZone. With just a click, the platform creates fully formatted reports through customizable templates that reflect your organization’s design and branding, saving tens to hundreds of hours of manual work each year while maintaining accuracy and consistency.
Come See What You Can Do With MaterialsZone
Request A Demo
.jpg)