COPQ (Cost of Poor Quality): Definition and 5 Examples
The Cost of Poor Quality (COPQ) is the total financial loss a company incurs when materials, processes, or end products fail to meet quality standards. The metric represents significant hidden costs for manufacturers in complex, data-heavy manufacturing and R&D industries such as chemicals, advanced materials, or FMCG products. AI-guided R&D platforms like MaterialsZone can effectively address the data and process issues that lead to excessive COPQ.
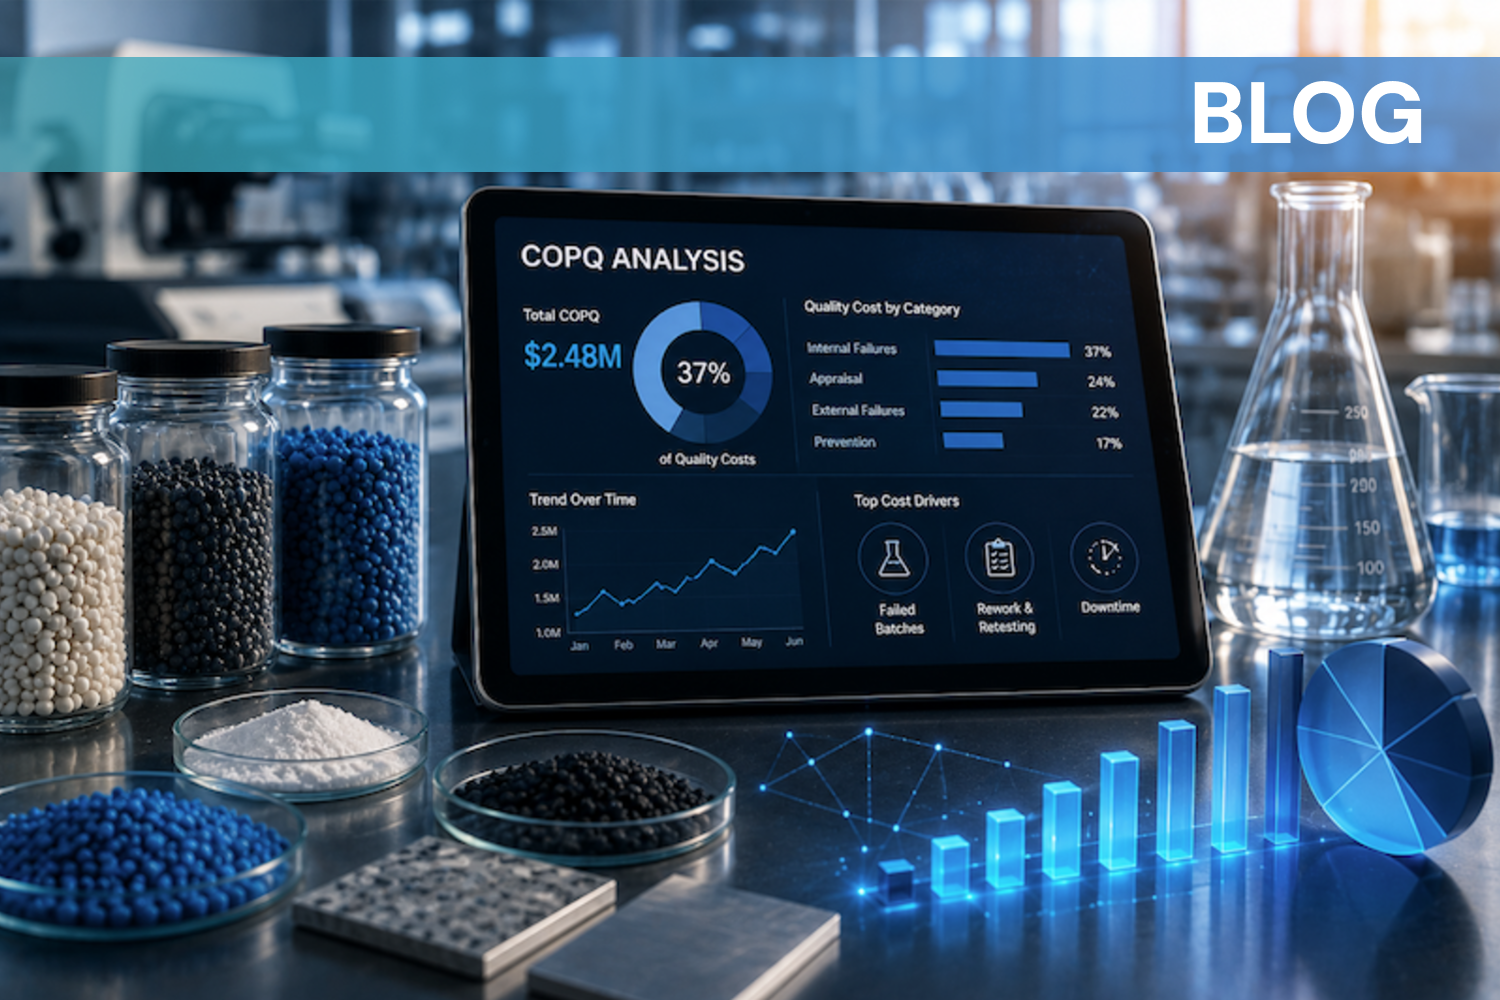

Quality failures in manufacturing and R&D can be expensive for organizations in ways that aren’t always immediately or intuitively apparent. Cost of Poor Quality, or COPQ, includes not only recalls and rework, but also wasted experiments, delayed launches, and missed compliance windows.
Many companies only comprehend a fraction of their true quality costs, which can range from 5 to 35 percent per sales dollar for manufacturing companies, more than enough to impact most profit margins. The COPQ metric helps surface these hidden costs and point teams toward their root causes.
To help you put COPQ insights to work in your organization, this post breaks down what you need to know about the metric, and provides five real-world examples of how it impacts manufacturing and R&D.
What is COPQ, and why is it important?
Cost of Poor Quality, or COPQ, represents the total financial loss a company incurs when materials, processes, or end products fail to meet quality standards the first time.
COPQ captures the failure portion of the broader Cost of Quality (COQ) framework. It does not include prevention or appraisal costs; it focuses on avoidable waste caused by internal and external quality failures. Parties responsible for tracking COPQ include R&D directors, QA/QC or production managers, innovation leaders, or anyone responsible for ensuring quality outcomes and efficient R&D.
COPQ is critically important in complex, data-heavy manufacturing and R&D industries that deal with chemicals, advanced materials, or FMCG products. In these environments, a single failed batch or formulation error during the product development lifecycle can have a cascading effect, resulting in weeks of rework, regulatory delays, and raw material waste. COPQ gives teams a framework for quantifying these losses and tracing them back to the failures that caused them.

How is COPQ Calculated?
Determining an accurate COPQ first requires a solid grasp of your overall cost of quality and how failures that result in “poor quality” factor into it. Quality costs can be categorized according to the PAF model: Prevention, Appraisal, and Failure.
- Prevention refers to the proactive steps taken to reduce costly quality issues.
- Appraisal covers the ongoing monitoring and testing that uncovers flaws and ensures consistent quality over time.
- Failure includes costs caused by defects, nonconformance, or quality failures in materials, processes, or finished products. COPQ falls within this category.
Failures can be divided into internal and external subcategories.
- Internal failure costs come from defects identified before a product or service reaches the customer.
- External failure costs come from defects identified after the product or service has reached the customer.
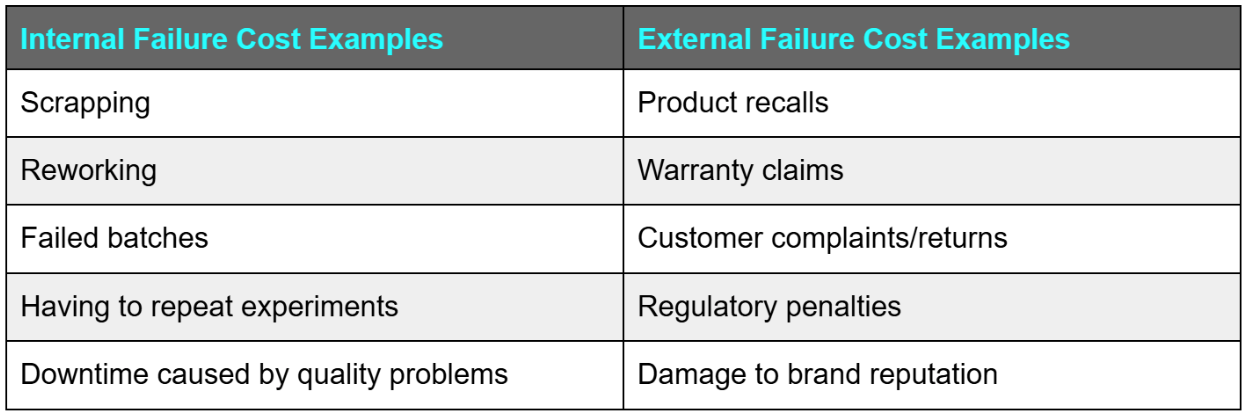
COPQ is then calculated by adding internal failure costs and external failure costs:
COPQ = Internal Failure Costs + External Failure Costs
Because few companies track their failure costs systematically, COPQ is frequently underestimated. Two similar companies in the same industry can have greatly divergent COPQ scores, depending on how their operations are managed. For example:
- Manufacturer A, with a COPQ of 7%, may have more controlled, data-driven quality processes.
- Manufacturer B, with a COPQ of 22%, may be operating with fragmented data, manual quality control processes, and a more reactive approach to quality.
What are the benefits of measuring COPQ?
Measuring Cost of Poor Quality (COPQ) offers many benefits, including:
- Surfacing Hidden Waste – Failure costs don’t always show up in standard P&L reports, but tracking COPQ forces organizations to account for the rework hours, scrapped materials, and repeated R&D cycles that silently eat away at project budgets.
- Focusing Quality Investments Where They Count – Instead of thinly spreading your QA resources over every potential problem area, COPQ data can show where failures concentrate, helping teams prioritize root cause analysis and target spending where it will have the greatest impact.
- Improving Cross-Functional Alignment – When R&D, QC, and production share the same quality cost metric, accountability and collaboration improve, while unproductive finger-pointing decreases.
- Strengthening Regulatory and Compliance Positioning – Tracking failure costs establishes audit evidence and a trail that supports compliance reporting.
- Accelerating Time to Market – Fewer failure cycles mean faster iterations. Organizations with low COPQ get their products to market faster and more consistently.
COPQ vs Cost Reduction vs COGQ
COPQ is often discussed alongside Cost Reduction and Cost of Good Quality (COGQ), but each term points to a different business decision. Here’s how to tell them apart:

5 Examples of COPQ (Cost of Poor Quality)
Here are five examples from materials-intensive industry sectors, showing how COPQ can emerge across R&D, QC, production, and post-release workflows:
1. Failed Prevention Control Leading to Internal Failure Costs (Chemicals):
To save time, a chemical company skips systematic pre-testing of a new formulation. Later in the development cycle, an unanticipated reaction causes repeated batch failures. The skipped prevention step turns into COPQ through multiple wasted experiment cycles, loss of raw materials, and product launch delays.
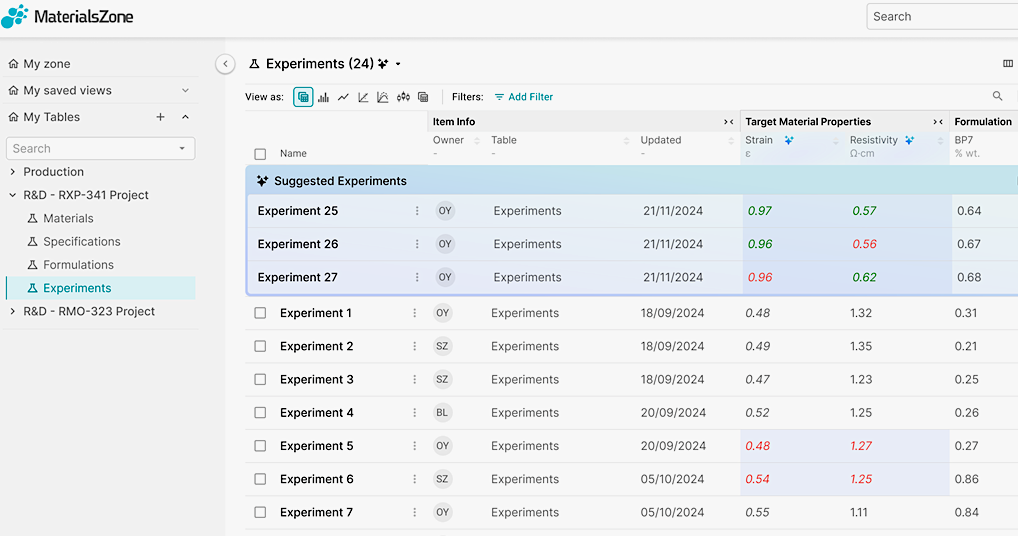
As a best practice to avoid internal failure costs downstream, teams should capture standardized testing protocols for reuse across projects and use historical formulation data to guide new experiments from the start. Tools like MaterialsZone’s Predictive Co-Pilot can replace the trial-and-error element with AI-guided experimentation, reducing iterations before they become costly failures that add to your COPQ.
2. Hidden Quality Waste: Duplicated QC Testing Caused by Fragmented Data (Advanced Materials)
Lacking a centralized data system, multiple teams within an advanced materials processing facility run the same QC tests independently and record results in separate systems. Conflicting test results are not reconciled before the material moves forward, causing the team to make decisions from incomplete or inconsistent data.
Duplicated testing is not always COPQ on its own; it becomes COPQ when fragmented data causes avoidable rework, delayed release, nonconformance, or repeated corrective testing.
When the issue is discovered later, the material requires rework before release, increasing COPQ through avoidable correction costs and delayed throughput. To avoid this, teams need shared QC data, clear visibility into what has already been tested and validated, reliable data pipeline tools, and a consistent way to compare results across departments.
Solutions like MaterialsZone’s Materials Knowledge Center and Visual Analyzer allow teams to consolidate testing data for cross-team analysis, identify inconsistent results earlier, avoid duplicate test cycles, and prevent fragmented QC data from turning into rework or delayed release decisions.
3. Internal Failure Cost: Lost Process Parameters Causing Mid-Production Batch Failure (Advanced Materials)
At an advanced materials facility, a batch fails in the middle of production because the process parameters from previous successful runs were not captured or made accessible to the production team.
The batch is scrapped, and the production line is paused while the team works backward to identify the missing conditions. The COPQ impact comes from the wasted material, lost production time, and delay before the process can be run again.
This kind of failure can be avoided by providing clear documentation of successful run parameters and making them available where production decisions are made. Tools that enable live sharing of process data, like MaterialsZone’s Collaboration Hub, can connect R&D, QC, and production teams in real time, ensuring that critical process knowledge remains accessible throughout scale-up and manufacturing.
4. External Failure Cost: Packaging Material Failure Causing Customer Returns (FMCG)
An FMCG company introduces a new packaging material to support a sustainability target. The material passes initial checks, but historical test data from real storage and transport conditions are not analyzed together before launch.
After the product reaches retailers, the packaging begins to fail under conditions that were not fully accounted for during validation. Some units arrive damaged, leading to rejected inventory and customer complaints. Because the issue is discovered after release, these losses fall under external failure costs and can raise COPQ quickly across a high-volume product line.
Before introducing a new packaging material, FMCG teams should evaluate historical material performance and environmental test results under realistic storage and transport conditions. MaterialsZone’s Visual Analyzer and Predictive Co-Pilot help teams detect patterns across multi-dimensional datasets, making it easier to identify risks that manual review may miss before products reach the market.

5. Hidden R&D Cost: Repeated Experiments Caused by Lost Institutional Knowledge (Advanced Materials)
An experienced researcher leaves an advanced materials company, and the team discovers that prior experiments are not captured in a structured, accessible system. A new team member repeats months of work that has already been completed, wasting R&D budget and delaying time to market. The impact also reaches the team itself, as researchers lose confidence that past work can be found and reused.
While not a formal PAF category, repeated experiments caused by lost institutional knowledge are a major hidden R&D quality cost. They should be included in COPQ analysis when the repeated work stems from failed documentation, nonconformance, rework, or avoidable quality-related failure cycles.
The cost of work already done, but invisible to the team doing it again, is one of the most undertracked sources of COPQ in materials R&D. It is a practical quality cost because lost knowledge turns into repeated work.
To reduce this risk, teams should capture all experimental data, including failed experiments, in a structured, searchable central system supported by clear data governance practices. The MaterialsZone Knowledge Center helps preserve institutional knowledge in an accessible format, so prior work remains available even as teams change.
Shine a Light on Hidden COPQ Issues
Cost of Poor Quality is one of the most under-tracked cost categories in materials R&D and manufacturing. Measuring it properly can pinpoint the quality failures that are draining your resources and give you a blueprint for correcting them.
MaterialsZone’s AI-guided materials informatics platform directly addresses the root causes of COPQ. Its advanced features help teams connect R&D data, process knowledge, and experimentation workflows so quality issues can be identified earlier.
Request a demo to see how MaterialsZone can help reduce Cost of Poor Quality across the R&D lifecycle.

.jpeg)