
Photovoltaics Design
Photovoltaics (commercially called solar panels) are the leading source of renewable energy for our homes and businesses, with more and more structures and open areas opting to have them installed, all of which means good news for our planet and the environment.
Photovoltaics benefits for the environment and for the planet are many: (1) cut down the energy consumed from fossil fuels; (2) no emissions; (3) renewable - there is plenty of sunlight; (4) requires no maintenance.
The global photovoltaics market is expected to grow from ~$200B in 2021 to ~$1,000B in 2028 at a growth rate of 25.9%.
Challenges in photovoltaics design
A typical photovoltaic device stack has a minimum of 5 layers: (1) back contact, (2) hole transporting layer, (3) absorber, (4) electron transporting layer, (5) and transparent conductive substrate. Each of the layers could vary in chemistry, composition, thickness, processing, properties, etc. This ends up with 100+ variables to consider while designing and developing a full-stack photovoltaic device. A human will face a difficulty in processing such a large amount of information and relations.
Photovoltaics’ performance is usually measured with a solar-simulator instrument mimicking sunlight illumination while applying voltage and measuring current (under illumination). The output from the measurement is an I-V curve scatter plot. For calculating the cell’s performance indicators, one needs to process the data from the I-V curve while considering meta-data inputs such as the cell's illumination area.
Such calculations may be repetitive and annoying on a daily basis. But AI/ML can automate the harvesting of this data. Furthermore it could make the accumulated data AI/ML ready such that insight dashboards can help the researchers visualize the data, design the next experiment and converge onto a digital twin of the product and operations.
Introducing new photovoltaics technology to the market requires a long process of photovoltaics design that can take a decade or more. The amount of experiments needed to fine tune the compositions, the processing procedures and parameters is endless.
As an example please go to the perovskite database project page to discover how much global research effort it requires to introduce new perovskite based solar cell technology and MaterialsZone contribution to this effort.
AI/ML digital transformation accelerates photovoltaics design
• What if you had a tool that allows you to quickly overview and analyze the R&D data by visualizing the relations between all the variables in a single view?
• What if you had a tool that automatically collects raw data from the solar simulator and processes it to obtain the key metrics of a photovoltaic device?
• What if you had the option to predict the performance of a photovoltaic device you just thought of?
• What if the number of experiments to reach a certain performance target could be significantly reduced?
• What if you had a tool that recommends what the next set of experiments should be in order to reach your target with the minimum amount of experiments, hence, shorter time?
MaterialsZone - the materials informatics platform
Overcoming the above mentioned challenges requires an organizational materials informatics platform (MIP) that harvests, digitizes, stores, normalizes and harmonizes the materials-related data across the organization. Once the data is harmonized and available in the cloud-based platform, getting AI-ML-based insights, performing big data analytics, sharing, commenting and collaboration across the organizational teams is as far as a click of a button.
MaterialsZone digital solutions for photovoltaics design
Given the high-dimensional nature of the photovoltaics design problem, with 100+ variables to consider, it prevents the researcher / scientist from seeing the trees from the forest and this results in trial-and-error experimentation instead of data-driven decisions.
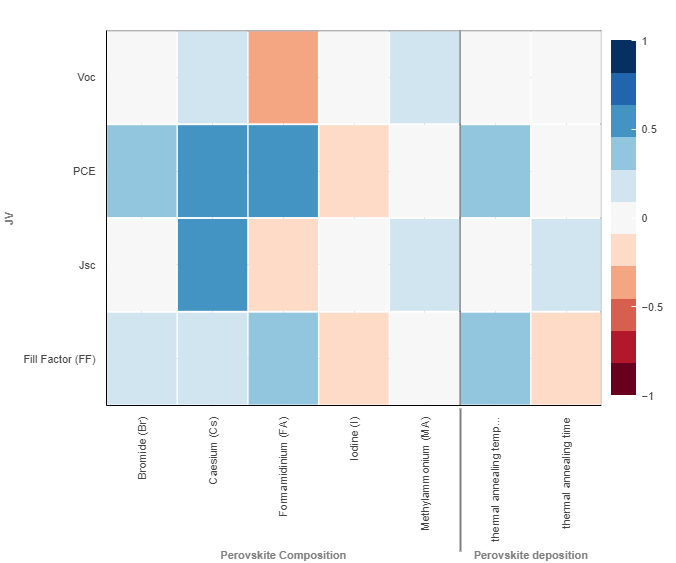
At MaterialsZone - the materials informatics platform, we created a dashboard specifically to solve this problem. The correlation dashboard visually presents the correlation between each variable against all others in a single view (figure 1).
Addressing the data processing problem photovoltaics design, we, in MaterialsZone, have decided to help scientists and researchers to focus on their jobs rather than manually processing data and doing calculations in preparation for AI/ML analysis. We have developed automations that collect raw data files from measuring instruments (aka a solar-simulator), process the data, calculate the performance indicators, and make it ready in the platform for immediate AI/ML analysis. In other words, we cut the routine work of processing the I-V curves to calculate the performance indicators and visualize them.
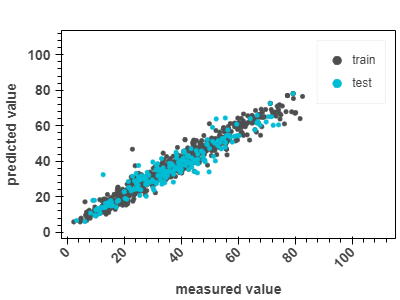
Shortening time to market or accelerating the photovoltaics design development by reducing the number of experiments relies on the capability of prediction using machine learning. Once the data collected is sufficiently rich, regression prediction models and SHAP analyses become increasingly relevant. The ultimate goal is to reach digital twin quality. A near perfect predictor of the outcome of any combination of inputs. Predictions are done through fitting a machine learning model as shown in figure 2.
As part of helping researchers to navigate through their data and accelerating their R&D processes, MaterialsZone has developed a unique SHAP analysis dashboard (SHAP refers to SHapley Additive exPlanations).
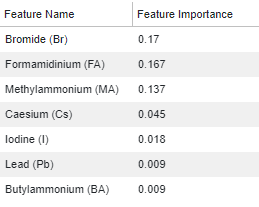
As an example, we built a model for predicting the PCE of a perovskite solar cell device based on the stoichiometry of the elements. Figure 3, extracted from MaterialsZone platform, shows the feature importance list from most import to less important. Features in this specific case are elements’ stoichiometry.
We can immediately see that the stoichiometry of Bromide is the most important. Meaning, Bromide stoichiometry is the feature (or the variable) that most influenced the model.
In addition to the feature importance shown in figure 3, the platform contains a bee swarm plot (figure 4) to further visualize the data.
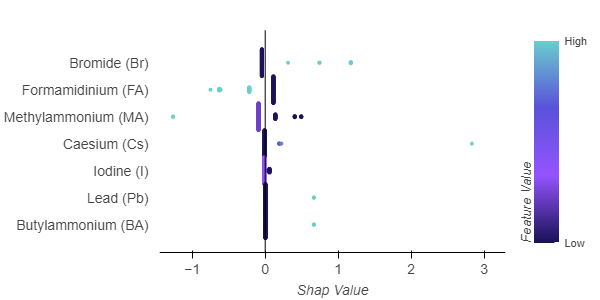
Some understandings from figure 4:
1. High Bromide stoichiometry will more likely result in high PCE (the predicted property).
2. High Formamidinium (FA) will more likely result in low PCE.
Once a model is built, with a virtual perovskite layer stoichiometry one can think of, the model can estimate the PCE of the photovoltaic device.
Now imagine that you can do this for any variable available in the dataset and reduce the number of experiments performed.
Whether you are developing solar cells, or any other materials-related or device-related company, Materials Zone, the materials informatics platform, will help your organization to accelerate its innovation and time-to-market via AI/ML insights and predictions from materials data:
• Less and shorter development cycles – faster and better data-driven decisions (reduced trial & error).
• Knowledge gap closure - design next experiment or data acquisition smarter/faster.
• Organizational wisdom - all the stakeholders, all the data, all the insights, in one cloud platform.
• Cross-functional efficiencies – R&D, supply chain, manufacturing, OEM/channel.